
In this project I used the K-means algorithm to cluster grocery items based on their transaction data.
Items that are often purchases together can be placed in the same aisle or aisles closer to each other, increasing sales!
This used to be done by human experts, which would require many years of experience in the industry to narrow things down. However, with the rise of big data and machine learning, why not let AI do all the trick and hard work for you?
Ok let’s get started. The first step is to gather the dataset. Here I downloaded the Instacart dataset from Kaggle, and filtered out items that don’t have a sufficient purchase history yet in the dataset (being purchased fewer than 100 times), because they may not contain enough information to be correctly classified(i.e. they may end up forming weird 1-item categories).
# Load dependencies
import pandas as pd
from scipy import sparse
from sklearn import metrics
from sklearn.cluster import KMeans
import matplotlib.pyplot as plt
import seaborn as sns

pd.set_option('display.max_rows', 30)

# Load the Instacart data and cluster items that have been purchased at least 100 times
df = pd.read_csv('data/order_products__train.csv')
df = df.drop(['add_to_cart_order', 'reordered'], axis=1)
df = df.groupby('product_id').filter(lambda x:len(x) >= 100)

df_products = pd.read_csv('data/products.csv')
df_aisles = pd.read_csv('data/aisles.csv')
The main table is pretty straightforward, classical order_id - product_id pairs.
df.head()
| order_id | product_id | |
|---|---|---|
| 1 | 1 | 11109 |
| 2 | 1 | 10246 |
| 3 | 1 | 49683 |
| 5 | 1 | 13176 |
| 6 | 1 | 47209 |
Now let’s transform the order data into a matrix where:
- each row is an order
- each column is a product
- each value 1 indicates a purchase
df['filler'] = 1
df = df.pivot(index='order_id', columns='product_id', values='filler').fillna(0)
df.head()
| product_id | 10 | 34 | 45 | 79 | 95 | 116 | 117 | 130 | 141 | 160 | ... | 49481 | 49517 | 49520 | 49533 | 49585 | 49605 | 49610 | 49621 | 49628 | 49683 |
|---|---|---|---|---|---|---|---|---|---|---|---|---|---|---|---|---|---|---|---|---|---|
| order_id | |||||||||||||||||||||
| 1 | 0.0 | 0.0 | 0.0 | 0.0 | 0.0 | 0.0 | 0.0 | 0.0 | 0.0 | 0.0 | ... | 0.0 | 0.0 | 0.0 | 0.0 | 0.0 | 0.0 | 0.0 | 0.0 | 0.0 | 1.0 |
| 36 | 0.0 | 0.0 | 0.0 | 0.0 | 0.0 | 0.0 | 0.0 | 0.0 | 0.0 | 0.0 | ... | 0.0 | 0.0 | 0.0 | 0.0 | 0.0 | 0.0 | 0.0 | 0.0 | 0.0 | 0.0 |
| 38 | 0.0 | 0.0 | 0.0 | 0.0 | 0.0 | 0.0 | 0.0 | 0.0 | 0.0 | 0.0 | ... | 0.0 | 0.0 | 0.0 | 0.0 | 0.0 | 0.0 | 0.0 | 0.0 | 0.0 | 0.0 |
| 96 | 0.0 | 0.0 | 0.0 | 0.0 | 0.0 | 0.0 | 0.0 | 0.0 | 0.0 | 0.0 | ... | 0.0 | 0.0 | 0.0 | 0.0 | 0.0 | 0.0 | 0.0 | 0.0 | 0.0 | 0.0 |
| 98 | 0.0 | 0.0 | 0.0 | 0.0 | 0.0 | 0.0 | 0.0 | 0.0 | 0.0 | 0.0 | ... | 0.0 | 0.0 | 0.0 | 0.0 | 0.0 | 0.0 | 0.0 | 0.0 | 0.0 | 0.0 |
5 rows × 2457 columns
print('Number of Transactions:', df.shape[0])
print('Number of Items:', df.shape[1])
Number of Transactions: 125956
Number of Items: 2457
Cool, now that everything has been set up, let’s transform the data into a similarity matrix. (here I used the cosine similarity, but other metrics should be fine).
Essentially, items that are often purchased together will have a similarity of 1, whereas those that have never been purchased together will have a similarity of 0.
# Save memories by converting it to a sparse matrix
data = df.to_numpy()
data_sparse = sparse.csr_matrix(data)
data_clustering = metrics.pairwise.cosine_similarity(data_sparse.T)
data_clustering = sparse.csr_matrix(data_clustering)
Then, time to apply the K-means algorithm using the similarity matrix we just obtained!
How do we choose K though? It’s usually more subject to the business requirements.
However, here what we can do is to pick a bunch of Ks and look at the inertia plot.
A range between 100 and 200 would probably be a good start since we don’t want to make things too complicated. (which works out to be around 10+ types of item per aisle)
cluster_inertia = []
for i in range(100, 220, 20):
    model = KMeans(n_clusters=i)
    model.fit(data_clustering)
    cluster_inertia.append(model.inertia_)

plt.plot(range(100, 220, 20), cluster_inertia)
plt.xlabel('Number of Clusters')
plt.ylabel('Inertia')
plt.show()
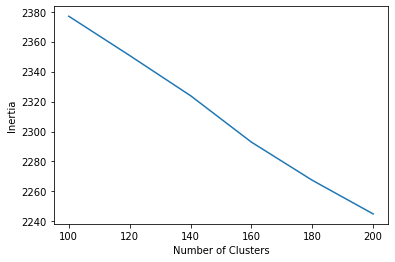
According to the plot, 200 seems to be a good choice since the line keeps going down.
Let’s plug it in!
kmeans = KMeans(n_clusters=200)

clusters = kmeans.fit_predict(data_clustering)
final_clusters = pd.DataFrame({'cluster':clusters,
                               'product_id':df.columns})
df_cluster = final_clusters.sort_values('cluster')
df_cluster = pd.merge(df_cluster, df_products, how='left', on='product_id')
df_cluster = df_cluster.drop(['aisle_id', 'department_id'], axis=1)
df_cluster
| cluster | product_id | product_name | |
|---|---|---|---|
| 0 | 0 | 31964 | Passionfruit Sparkling Water |
| 1 | 0 | 49520 | Orange Sparkling Water |
| 2 | 0 | 49191 | Cran Raspberry Sparkling Water |
| 3 | 1 | 5883 | Organic Strawberry Lemonade |
| 4 | 1 | 8929 | Organic Chicken Pot Pie |
| ... | ... | ... | ... |
| 2452 | 199 | 32747 | Low Fat 1% Milk |
| 2453 | 199 | 45116 | Potatoes Sweet |
| 2454 | 199 | 40354 | California Clementines |
| 2455 | 199 | 7419 | Sweet Red Grape Tomatoes |
| 2456 | 199 | 11265 | 100% Natural Diced Tomatoes |
2457 rows × 3 columns
Get some basic stats regarding our clusters.
sns.distplot(df_cluster['cluster'].value_counts())
/Users/ree/PycharmProjects/Personal/grocery-item-clustering/venv/lib/python3.8/site-packages/seaborn/distributions.py:2619: FutureWarning: `distplot` is a deprecated function and will be removed in a future version. Please adapt your code to use either `displot` (a figure-level function with similar flexibility) or `histplot` (an axes-level function for histograms).
  warnings.warn(msg, FutureWarning)


<AxesSubplot:xlabel='cluster', ylabel='Density'>
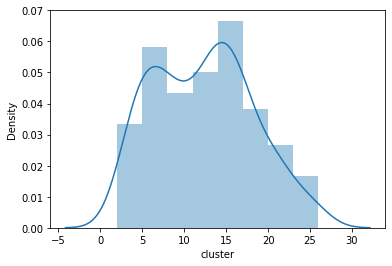
The group counts seem quite reasonable. Let’s inspect some of the categories manually!
df_cluster.query('cluster == 1')
| cluster | product_id | product_name | |
|---|---|---|---|
| 3 | 1 | 5883 | Organic Strawberry Lemonade |
| 4 | 1 | 8929 | Organic Chicken Pot Pie |
| 5 | 1 | 28769 | Organic Apple Chicken Sausage |
| 6 | 1 | 29370 | Organic White Cheddar Popcorn |
| 7 | 1 | 16363 | Gluten Free Breaded Chicken Breast Tenders |
| 8 | 1 | 37971 | Organic Cranberry Pomegranate Juice |
| 9 | 1 | 35383 | Classic White Bread |
| 10 | 1 | 45957 | Peach Mango Salsa |
| 11 | 1 | 30967 | Organic Frosted Flakes Cereal |
| 12 | 1 | 13640 | Asian Pears |
| 13 | 1 | 18200 | Aged White Cheddar Gluten-Free Baked Rice And ... |
| 14 | 1 | 40878 | Macaroni And Cheese |
| 15 | 1 | 37464 | Apple Cinnamon Instant Oatmeal |
| 16 | 1 | 39160 | Kefir Cultured Strawberry Milk Drink |
df_cluster.query('cluster == 2')
| cluster | product_id | product_name | |
|---|---|---|---|
| 17 | 2 | 17429 | Jalapeno Hummus |
| 18 | 2 | 39475 | Total Greek Strained Yogurt |
| 19 | 2 | 5479 | Italian Sparkling Mineral Water |
| 20 | 2 | 10017 | Tilapia Filet |
| 21 | 2 | 21543 | Organic Quick Oats |
| 22 | 2 | 16521 | Walnut Halves & Pieces |
| 23 | 2 | 16083 | Organic Large Brown Eggs |
| 24 | 2 | 45965 | Steel Cut Oats |
| 25 | 2 | 31869 | Organic Edamame |
| 26 | 2 | 19660 | Spring Water |
| 27 | 2 | 20842 | Total 0% Greek Yogurt |
| 28 | 2 | 5134 | Organic Thompson Seedless Raisins |
| 29 | 2 | 20734 | Organic Medjool Dates |
| 30 | 2 | 7503 | Whole Almonds |
| 31 | 2 | 17872 | Total 2% Lowfat Plain Greek Yogurt |
| 32 | 2 | 44422 | Organic Old Fashioned Rolled Oats |
| 33 | 2 | 18027 | Ezekiel 4:9 Bread Organic Sprouted Whole Grain |
df_cluster.query('cluster == 3')
| cluster | product_id | product_name | |
|---|---|---|---|
| 34 | 3 | 27398 | Genuine Chocolate Flavor Syrup |
| 35 | 3 | 12099 | Honey Greek Yogurt |
| 36 | 3 | 36994 | Organic Graham Crunch Cereal |
| 37 | 3 | 38563 | Mint Chocolate Chip Ice Cream |
| 38 | 3 | 32156 | Cranberry Juice Cocktail |
| 39 | 3 | 40486 | Chicken Tenders |
| 40 | 3 | 35199 | 100% Apple Juice |
| 41 | 3 | 30597 | French Vanilla Coffee Creamer |
| 42 | 3 | 15780 | Breakfast Blend Medium Roast Ground Coffee |
| 43 | 3 | 43889 | Dark Chocolate Covered Banana |
| 44 | 3 | 17334 | Coffee Ice Cream |
| 45 | 3 | 3479 | Classic Whipped Cream |
| 46 | 3 | 19511 | Half And Half |
| 47 | 3 | 38548 | Gala Apple |
| 48 | 3 | 45061 | Natural Vanilla Ice Cream |
| 49 | 3 | 18171 | Natural Sunflower Spread |
Voila!
- For cluster 1 I cannot seem to find an obvious category, but apparently they are often bought together!
- Cluster 2 seems to be healthy/organic food
- Cluster 3 seems to be sweet, breakfast and coffee stuff